
TV and video streaming services have experienced unprecedented growth in userbase and revenue in the last few years. The changes in consumer behavior during this period were caused in part by Covid-19 and its consequences, as well as an increasingly competitive market and ever-growing online content libraries. On its own, Netflix UK added almost 900 titles to its library in 2022, without even counting its licensed content, for example.
The commercial impact of these changes means that marketers are paying attention to TV ratings, viewership statistics, and trends – both across traditional media and streaming segments. The place of must-watch TV has been taken by must-binge box sets – and in the last few years, you’ve very likely been asked the question, “Have you caught up with “X” on Netflix?”
In this article, we break these statistics down across segments, demographics, and content. Let’s dive in.
TV Viewership Trends
First, let’s take a look at the major TV viewership trends of the last few years.
The Rise of Streaming Services
Streaming on Netflix, Amazon, Hulu, and other services has been steadily increasing in the last decade, thanks to changes in consumer behavior. In fact, the streaming market is predicted to reach $416.84 billion by 2023, with a CAGR of 21.5%. Netflix’s global number of subscribers grew to over 232.2 million in Q1 of 2023, meanwhile.
The Decline in Traditional TV Viewership
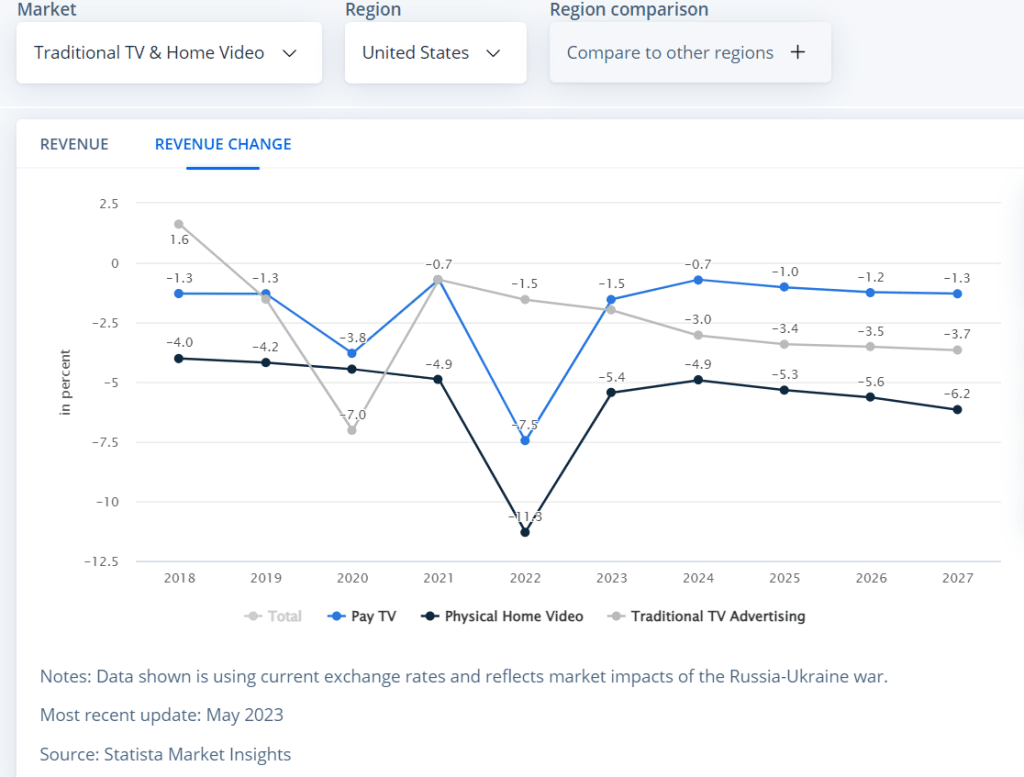
The popularity of streaming services is causing a decline in traditional TV viewership. In contrast with the streaming market, which is projected to grow in the next few years, the traditional TV market’s CAGR is predicted to be -2.11%, and the market size to drop to $137 billion by 2027. At the same time, the number of US households with pay TV is expected to drop 50% by 2027 from 100 million in 2014.
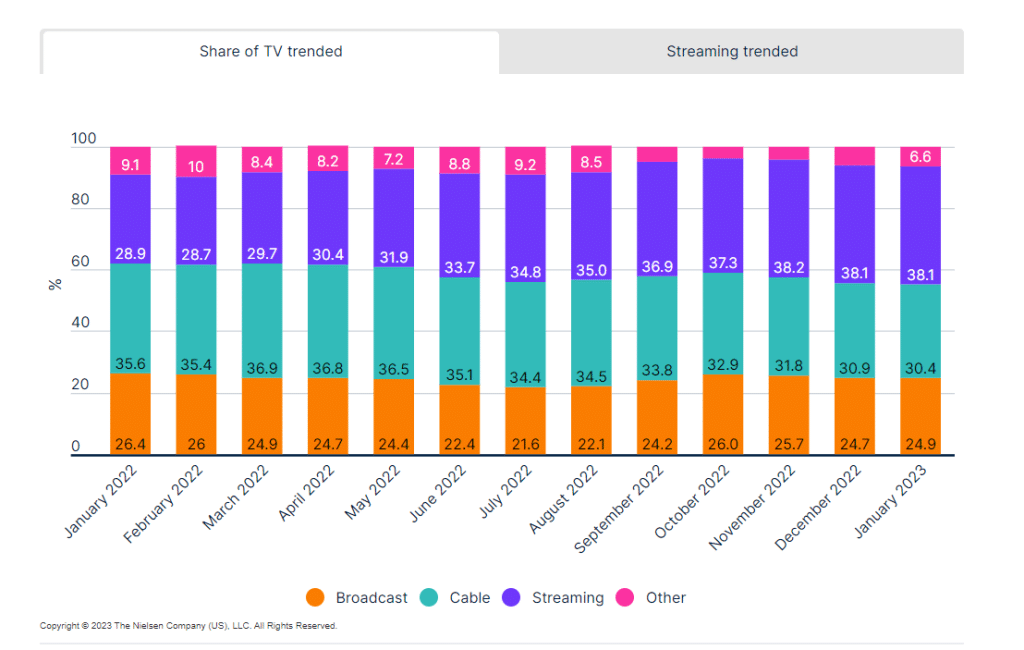
According to a Nielsen report of July 2022, streaming surpassed traditional TV (both broadcast and cable) for the first time ever that month, with a 34.8% share of overall TV viewership.
And this trend hasn’t changed since. Nielsen data confirms that streaming had a 38.1% share of TV viewership in January 2023 and a 34.3% share in February.
Cord-Cutting
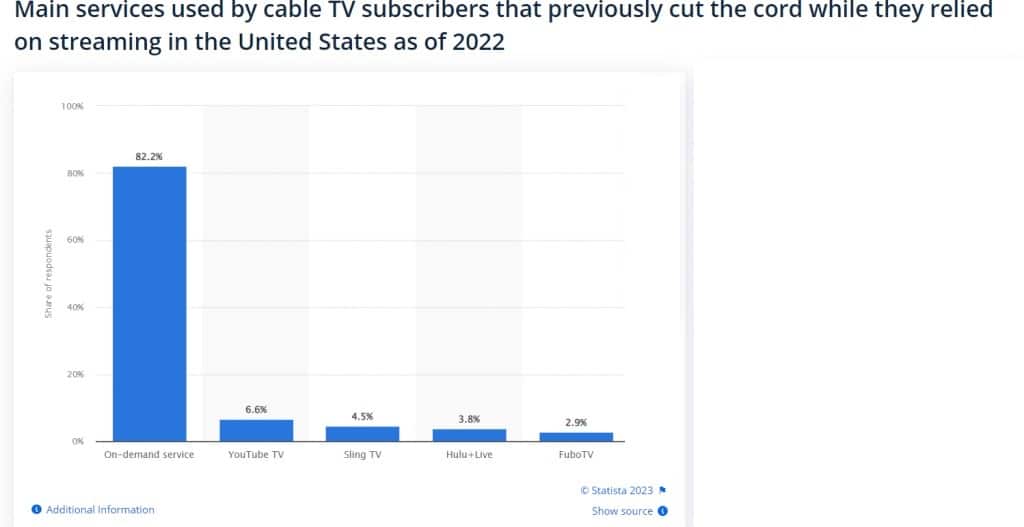
Source: Statista
The practice of cord-cutting refers to users permanently canceling their traditional TV subscriptions (from cable, satellite, and so on) and switching to streaming services. It’s been on the rise in the last few years, and some 20% of 18-54-year-olds in America are extremely likely to cancel their TV subscriptions this year. An overwhelming majority of consumers who cut the cord switched to on-demand streaming services like Netflix.
Shifting Demographics
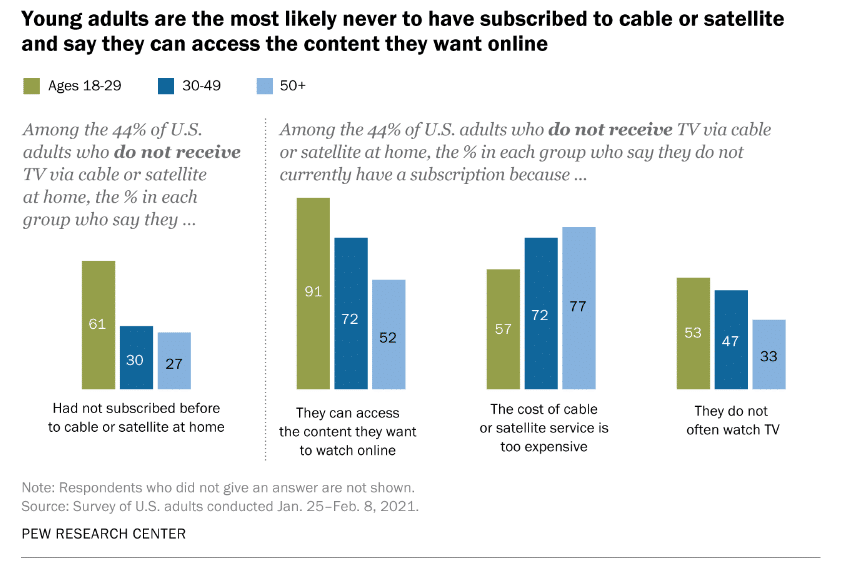
Source: Pew Research
TV viewing habits vary across generations. For instance, over 60% of Americans under 30 prefer to stream content online rather than watch it on TV. Furthermore, over 60% of adults under 30 have never even had a cable or satellite subscription.
Indeed, the biggest audience for broadcast and cable TV are adults aged over 50: 90% of them watch TV in the traditional way.
These variations must be taken into account by advertisers and marketers when creating content and developing ad strategies. We’ll dive into more TV demographics in the next section.
Analysis of TV Viewership Statistics
TV viewership statistics on demographics, geography, and even social media behavior related to TV watching can provide valuable insights into consumer behavior. Let’s take a closer look.
Demographic Analysis
Like this infographic? Feel free to use it on your website or blog, but please remember to give us credit by linking back to techreport.com/statistics/tv-viewership-statistics in your post.
The statistics about TV watchers’ demographics are very telling. For example, only 34% of US adults under 30 reported having cable or satellite television in 2021. For the Boomer generation, the figure was much higher: 81%.
It follows that younger adults prefer streaming over traditional TV. In fact, 70% of users of video streaming services are in the 18-44 age group, with 28-34-year-olds making up 28.5% of that segment.
In terms of income, 35% of Americans with an income over $75k per annum are using streaming services rather than traditional TV.
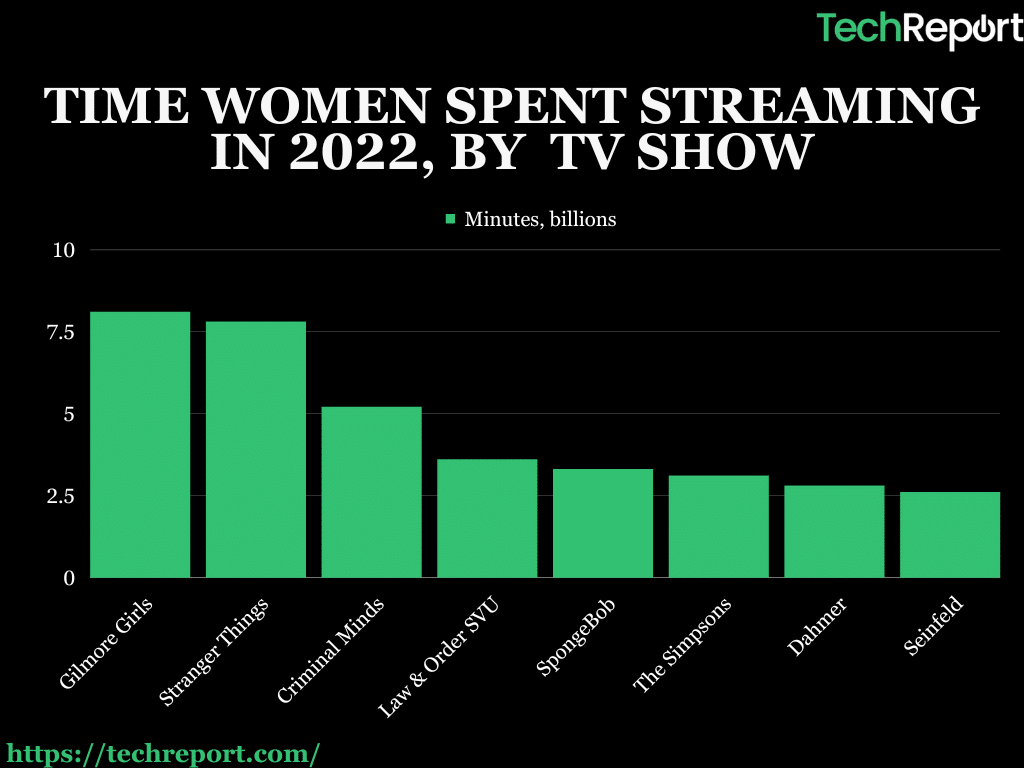
And when it comes to gender, the use of streaming services is fairly evenly across male and female users. Nielsen also found that 18-34-year-old women have an increasing preference for watching “Comfort TV” – much-loved shows like “Gilmore Girls” from a decade or two ago.
In fact, comfort TV accounted for over 50% of the top 25 shows streamed by women in 2022. Women streamed these top shows for over 104 billion minutes in total in 2022, compared to 67 billion minutes watched by men.
This type of content data can be very helpful for gauging the popularity of shows. Let’s take a closer look at TV viewership content analytics.
Content Analysis
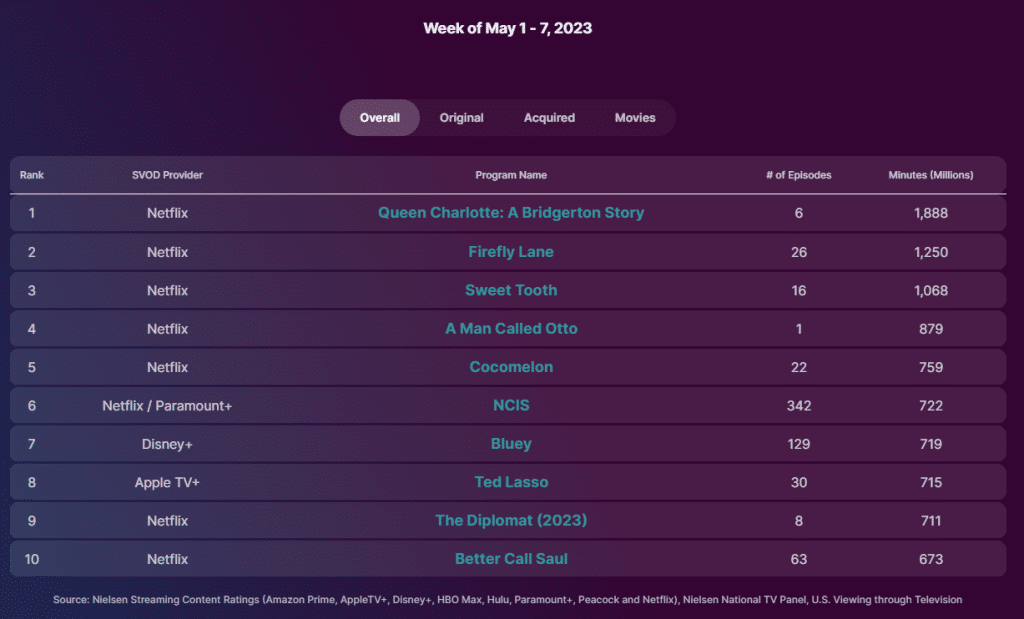
Solutions like Statista and Nielsen’s Top Ten provide insights into the top content watched or streamed during specific periods. They can hence help assess the popularity of specific content.
Marketers who work with the NBA should take note of their African-American audience: over 3.5 million African-Americans watched the prime time TV NBA final in July 2021.
However, the Super Bowl TV ratings were at an all-time low (36.9) in 2022, which was undoubtedly a blow to advertisers.
Another interesting sports content statistic comes from the UK. The strong performance of England’s football teams drew in a huge number of TV viewers in 2021. And the 11.2 million viewers who watched the 2022 Women’s Euro Final points to the increasing popularity of Women’s Football – a statistic that marketers cannot miss.
Interestingly enough, 38% of UK fans of streaming TV prefer UK-made programs, with 52% of Brits enjoying US and UK-made programs equally. Foreign-language programs are also gaining popularity with UK Gen Z adults – something that content producers and marketers should consider when looking at the UK market.
Geographic Analysis
Geographical differences in TV viewership can highlight consumers’ different preferences around the world. For example, 9 out of 10 Brits used at least one streaming platform in 2022. In the US, the same figure was 8 out of 10.
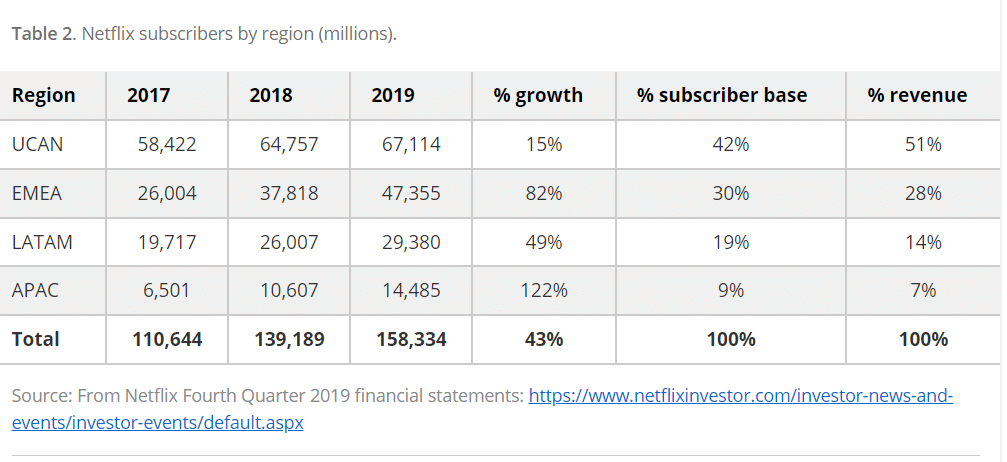
However, the number of viewers is just one metric that advertisers can use to develop their geographical strategies. For example, despite Netflix’s 122% growth in the APAC region in 2019, user penetration was the lowest in the world. The streaming platforms would hence need to focus on increasing user penetration in that region and focus on increasing subscriber base in LATAM, for instance.
Cross-Platform Analysis
Finally, analytics from other platforms like social media and blogs, where users post about the shows they’re watching, can provide organic data on user preferences, helping marketers form more informed content strategies.
Future of TV Viewership Statistics
Current and upcoming technological advancements like AI and intelligent automation will significantly impact consumers’ TV habits and hence TV viewership statistics. Today, TV viewership statistics are more comprehensive and precise than TV ratings charts in the past, thanks to advancements in data analytics and integration with other data sources.
Let’s look at some future trends.
Increased Use of Data Analytics
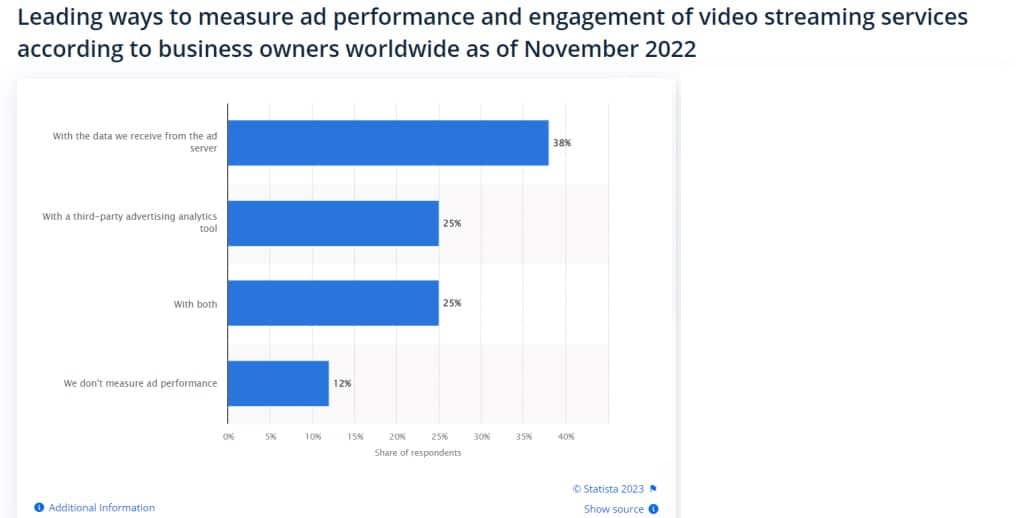
Source: Statista
Data analytics has become a powerful tool for predicting TV viewership trends. Predictions used to be limited to small samples and brief surveys, which often meant imprecise results. However, armed with advanced analytics, TV networks and streaming platforms can now pull data from a wide range of different sources, like smart TVs and cell phones.
By analyzing huge amounts of data with intelligent automation and AI, providers can gain important insights into the preferences and habits of TV watchers. This data-driven approach enables them to create informed content, schedules, and ad decisions. These decisions allow networks and streaming platforms to tailor their offerings to meet the demands of their target audiences, resulting in more engaging and optimized TV experiences.
Integration with Other Data Sources
The integration of TV viewership data with other data sources is another crucial innovation shaping the future of the industry. TV networks are increasingly partnering with social media platforms and streaming services to gather more comprehensive insights, such as those sought by Samsung partner brands. Social media provides real-time feedback, enabling networks to gauge viewer engagement and the impact of programs and ads. These collaborations also offer cross-promotion, content discovery, and audience expansion opportunities.
Furthermore, integrating TV viewership data with data from other sources can provide valuable information. For instance, combining viewership data with e-commerce data (especially from live social media shopping) can help marketers see patterns related to video ads and consumer purchasing behavior. Such integrations also enhance understanding of the consumer journey and enable advertisers to deliver more personalized campaigns.
Emphasis on Targeted Advertising
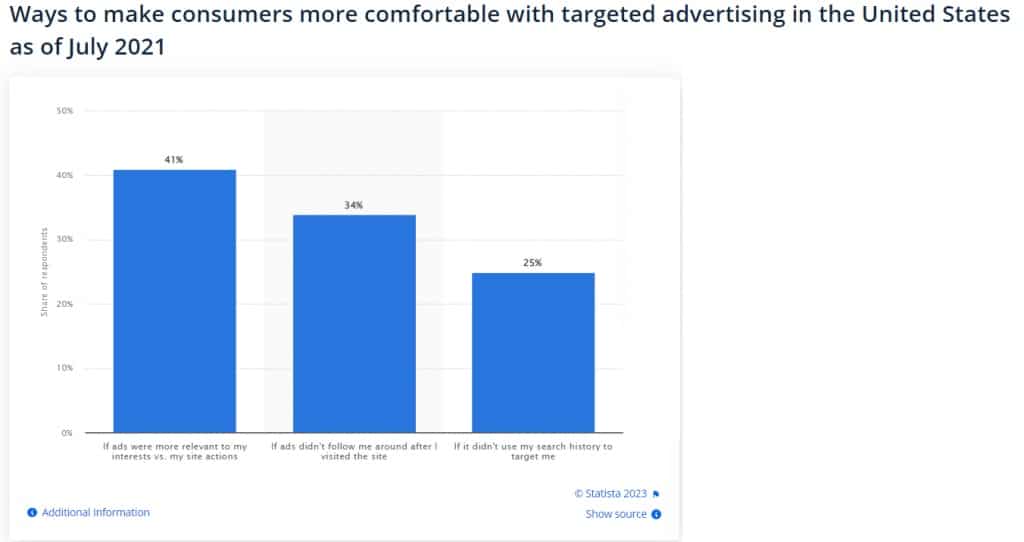
Source: Statista
Given the vast amount of TV viewership data available, advertisers can potentially deliver highly personalized and relevant ads to specific audiences. This shift from traditional mass campaigns to targeted advertising allows advertisers to optimize their budgets, increase conversion, and improve ROI.
Targeted advertising also benefits viewers, as they are more likely to see ads that respond to their needs. According to Statista, over 40% of TV viewers would prefer more relevant targeted ads.
Personalized ads create a more engaging viewing experience. Networks can capitalize on viewership data to deliver relevant content recommendations and promotions, increasing customer satisfaction and retention levels.
Continued Growth of Streaming Services
Streaming services are disrupting the traditional TV landscape. They offer viewers a far greater choice of content as well as convenience and flexibility. The rise of original content made by streaming giants has consequently attracted massive audiences, leading to a decline in traditional TV viewership.
As streaming services continue to gain popularity, the measurement and analysis of viewership statistics becomes ever more vital. Streaming services rely heavily on data analytics to understand viewers’ preferences, optimize recommendations, and increase engagement and conversion. They can benefit enormously from capturing detailed viewership data, allowing them to refine their strategies and make data-driven decisions.
Top Takeaways – Key TV Viewership Statistics & Insights
- 70% of users of video streaming services are in the 18-44 age group, with 28-34-year-olds making up 28.5% of that segment.
- The streaming market is predicted to reach $416.84 billion by 2023, with a CAGR of 21.5%.
- The traditional TV market’s CAGR is predicted to be -2.11%, and the market size will drop to $137 billion by 2027.
- “Comfort TV” accounted for over 50% of the top 25 shows streamed by women in 2022.
- 41% of American TV viewers would be more comfortable with ads if they were targeted to them.
Do People Still Watch TV?
The short answer is yes. However, TV viewership is changing – and streaming services are a huge part of the reason why.
Whether your target audience prefers to watch broadcast TV, cable TV, or Netflix, you should pay attention to their behaviors to ensure the decisions you’re making on ads and marketing are specific to them and are relevant. Data analytics is a great strategy for that – and with huge AI advancements happening now, it‘s just the beginning.
References
- 61 Stats & Demographics On Cable Network Users (2023 Update) (Techpenny)
- Big changes coming to the NFL’s sports betting landscape this season (ESPN)
- Biggest audience demographics you can reach with TV ads (Millenia3)
- Cable and satellite TV use has dropped dramatically in the U.S. since 2015 (Pew Research)
- High-demand sports and streaming content fuel a rise in total TV usage in January (Nielsen)
- In between the global and the local: Mapping the geographies of Netflix as a multinational service (International Journal of Cultural Studies)
- Leading primetime broadcast TV programs among African-Americans in the United States in July 2021, by number of viewers (Statista)
- Leading ways to measure ad performance and engagement of video streaming services according to business owners worldwide as of November 2022 (Statista)
- Media nations: UK 2022 (Ofcom)
- Netflix Library by the Numbers 2022 (What’s On Netflix)
- Number of Netflix paid subscribers worldwide from 1st quarter 2013 to 1st quarter 2023 (Statista)
- Number of pay TV households in the United States from 2013 to 2027 (Statista)
- Perceived benefits of livestream shopping worldwide in 2022 (Statista)
- Share of population who receive TV via cable or satellite in the United States in 2021, by age group (Statista)
- Traditional TV & Home Video – United States (Statista)
- TV streaming statistics in the UK (Finder)
- Uncovering the Trends: A Deep Dive into TV Viewers Statistics 2023 (Gitnux Blog)
- Video-on-Demand – United States (Statista
- Video Streaming Market Size Worth $416.84 Billion By 2030 (Grand View Research)
- Streaming claims largest piece of TV viewing pie in July (Nielsen)
- Ways to make consumers more comfortable with targeted advertising in the United States as of July 2021 (Statista)
- With almost 1 million video choices, women 18-34 turn to classic TV (Nielsen)