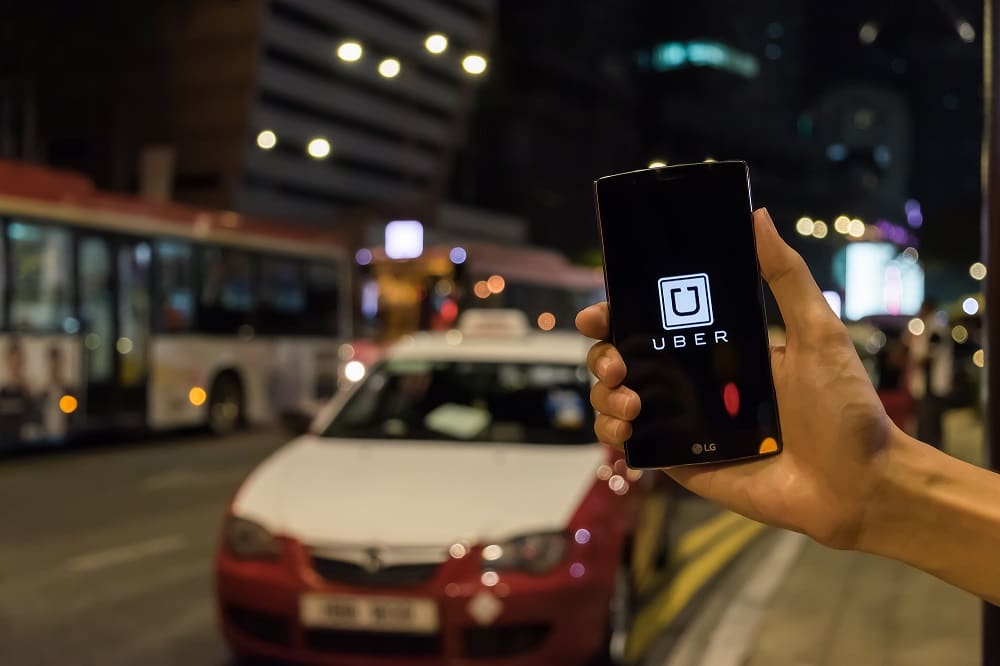
We’ve all taken an Uber on a night out or during a busy shopping day to get home – the company offers a service that’s easier and far more convenient than hailing a taxi.
Indeed, convenience and price are some of the biggest reasons why the ride-sharing company Uber has been a true trailblazer in the transport industry since its inception in 2009. Now active in over 70 countries and with over 130 million quarterly active users, Uber has revolutionized the transport sector – and is making inroads in many other industries.
But how is Uber making money, and how has it retained its position despite many controversies and legislative tussles over the years? Who is using it, and where? And how is it changing the gig economy and the meaning of being an independent contractor?
In this article, we’ll review the key Uber statistics and trends related to its demographics, usage, revenue, and influence around the world. Let’s dive in.
Key Uber Statistics for 2023
- In Q1 of 2023, there were 2.12 billion rides taken with Uber worldwide, up from 1.71 billion rides taken during Q1 of 2022.
- The number of Uber users reached 131 million during Q1 of 2023.
- As of Q4 2022, there were 5.4 million Uber drivers and couriers using the platform worldwide.
- In 2022, the total net revenue of Uber was $31.88 billion – almost double the year before ($17.46 billion).
- Uber went through 32 funding rounds, raising $25.2 billion.
- 99.9% of Uber trips taken in the US in 2019-2020 occurred without any incidents.
- Over 150,000 American drivers filed arbitration claims against Uber in 2022, resulting in Uber paying $512 million in settlement.
Uber Rides & Bookings Statistics
The main activity of the Uber company is rides, which can be booked through the Uber app. Let’s take a look at the statistics around Uber rides and bookings.
Rides Statistics
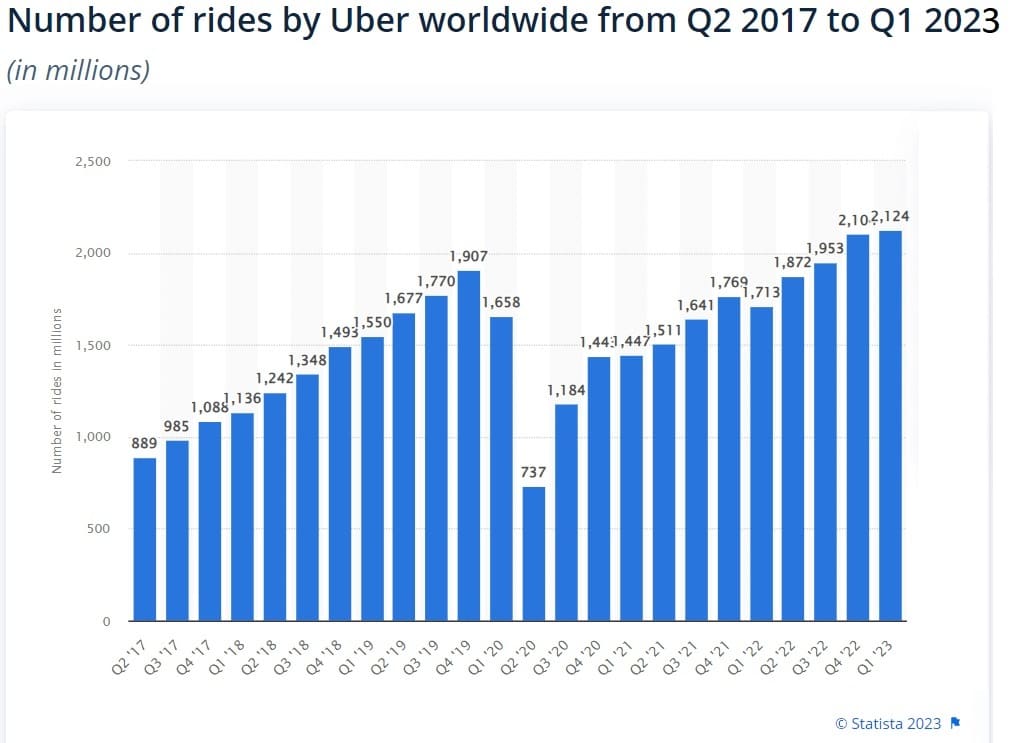
Source: Statista
In Q1 of 2023, there were 2.12 billion rides taken with Uber worldwide. This figure reflects a YoY growth of 24%, from 1.71 billion rides taken during Q1 of 2022.
The 2-billion mark was surpassed for the first time in Q4 of 2022, which saw 2.1 billion Uber rides. The YoY growth at the end of December 2022 was 19%, as the last quarter of 2021 saw almost 1.77 billion rides.
The lowest number of rides in the period (737 million) was recorded in Q2 of 2020, coinciding with COVID-19 lockdowns. However, the number of quarterly rides has been growing steadily since then, reaching a 24% YoY increase in Q1 of 2023.
Bookings Statistics
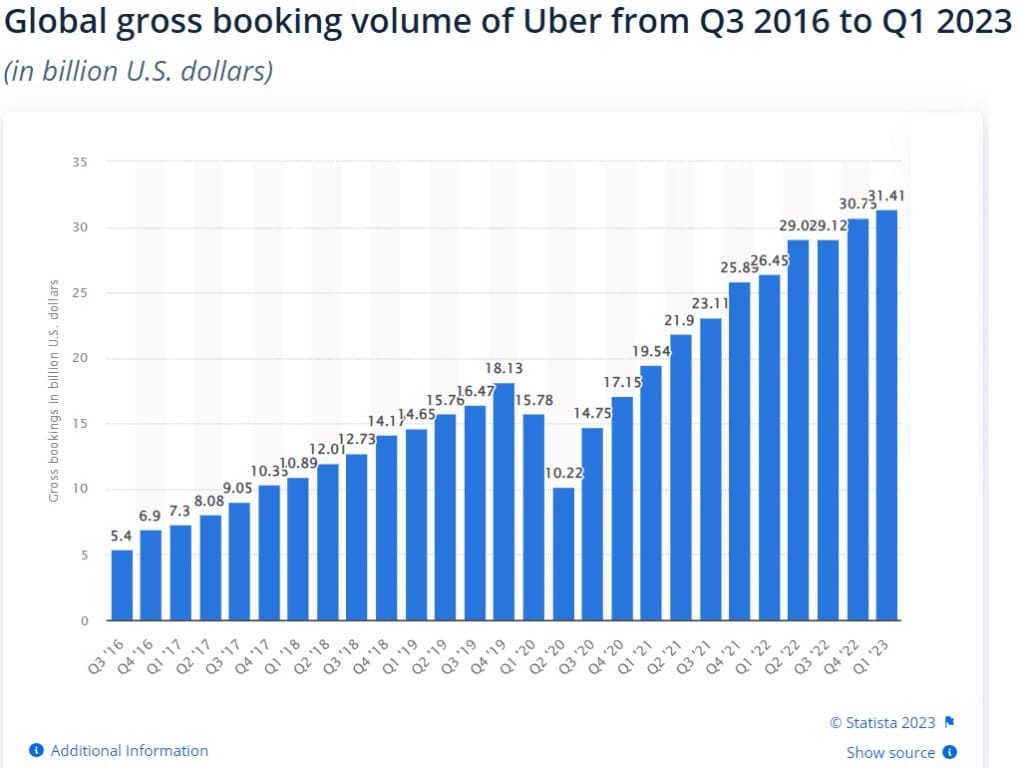
Source: Statisa
In terms of how much these rides cost, statistics tell us that Q1 of 2023 was the most successful period. In that quarter, the gross value of bookings reached $31.41 billion – $0.66 billion more than in the previous quarter.
As expected, the gross booking value figures for Q2 of 2020 were the lowest since 2017, at $10.22 billion. However, as lockdowns eased, the figures grew, reaching $17.15 billion in Q4 of 2020.
Most Popular Times & Destinations
According to Uber, the most popular destination in the world to travel to by Uber is the Empire State Building in New York. In fact, one Uber driver went there more than 250 times in 2021 alone.
Perhaps surprisingly, the Selfridges department store in London was the most popular Uber destination in Europe in 2021. It was closely followed by the Arc de Triomphe in Paris and the Blue Mosque in Istanbul.
In terms of demand, New Year’s Eve and Day are the busiest days of the year for Uber drivers, with December being the busiest month due to holiday traffic. Indeed, holidays like the Fourth of July and St Patrick’s Day are some of the most popular days to hail an Uber.
Weekends also tend to be busy days for Uber drivers. And unsurprisingly, the busiest hours for drivers on weekdays are the peak hours of 7-9 am and 5-7 pm.
Uber Ride-Hailing User Statistics
Uber is used around the world by millions of people every day – both by ride-hailers and drivers. We’ll now take a closer look at the transport giant’s global reach and who its users are.
In this section, we’ll specifically look at users who hail Uber rides.
Global Operation Statistics
As of January 2023, Uber is operational in 90 countries and 10,500 cities. In many of them, it operates under its own name. However, in some countries, the company offers its services with or through a local partner.
Here’s an overview of such partners around the world:
| Country | Local Uber Affiliate |
| Russia, Kazakhstan, Belarus, Armenia, Azerbaijan, Georgia | Yandex.Taxi |
| China | Didi Chuxing |
| Bahrain, Egypt, Jordan, Lebanon, Morocco, Pakistan, Palestine, Qatar, Saudi Arabia, Sudan, UAE | Careem |
| Cambodia, Indonesia, Malaysia, Myanmar, Philippines, Thailand, Vietnam | Grab |
And despite its global success, Uber is banned in some countries and cities. These include:
- Italy (some cities)
- Bulgaria
- Hungary
- Denmark
- Germany (except Munich and Berlin)
- Macau
- Trinidad and Tobago
- Northern Australia
Uber Active Users
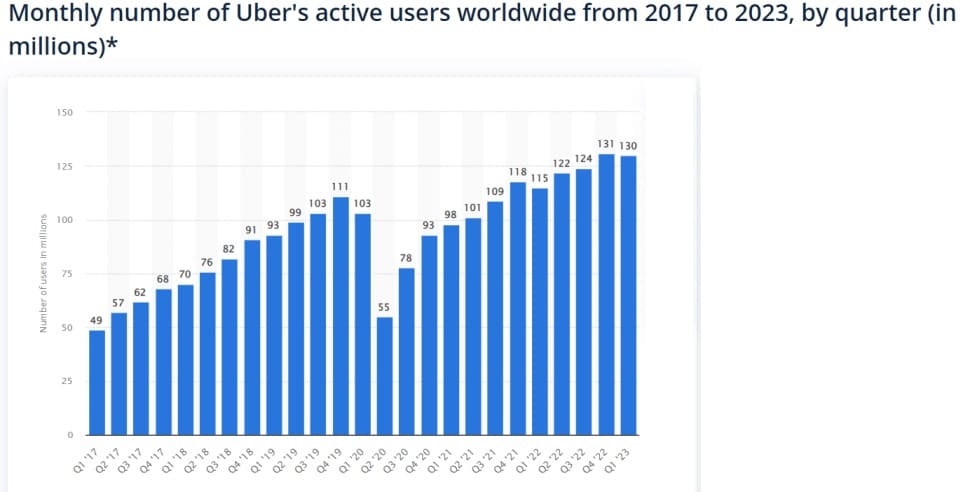
Source: Statista
The fourth quarter of 2022 saw the highest number of active Uber users. The number of users reached 131 million in that period – equal to almost half the population of Indonesia. In Q1 of 2023, usage dipped slightly to 130 million users.
And Q2 of 2020 saw the lowest engagement levels since the start of 2017 – falling to only 55 million users worldwide.
Demographics of Users
According to SimilarWeb and Zippia, the most represented age group for Uber users is 18-34-year-olds, who make up 44.4% of the ride-sharing service’s users. 35-44-year-olds follow, at 22.33%.
Here’s what we found out about Uber users in terms of area, income, and education:
- Only 36% of 18-29-year-olds from rural areas use Uber, compared to 55% from urban areas.
- 53% of Uber users are in the $75k per annum income bracket, with 71% of them being from an urban area.
- College graduates make up 55% of Uber’s user base, and 70% of them are urban-based.
Reasons for Choosing Uber & User Loyalty
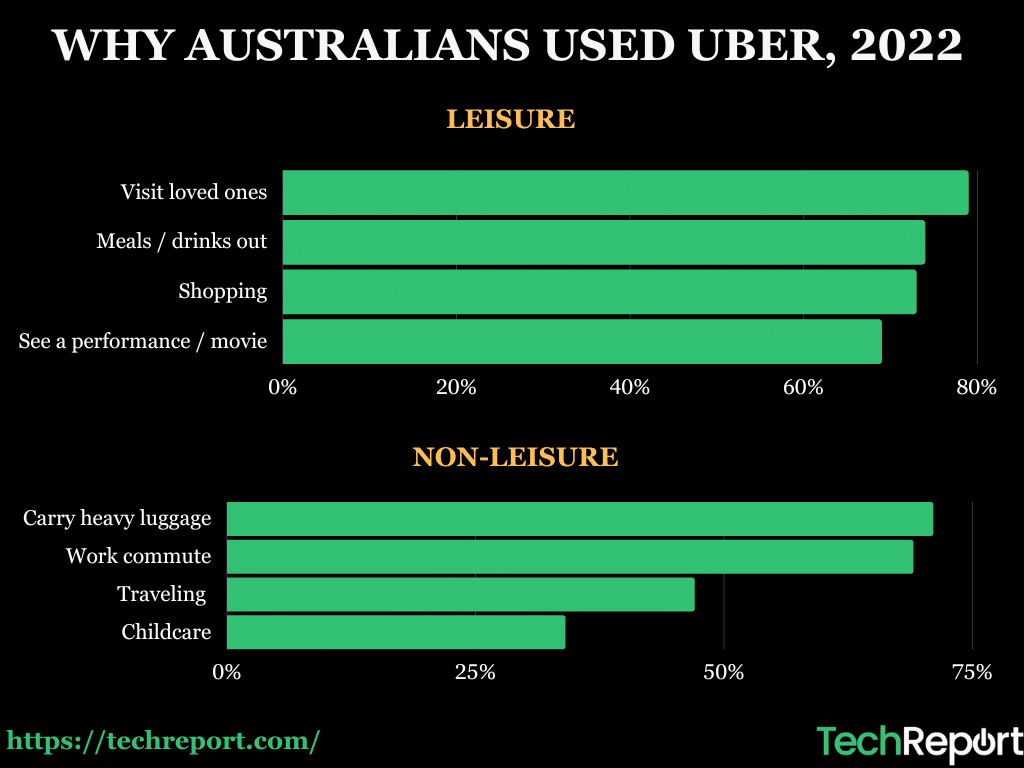
Like this infographic? Feel free to use it on your website or blog, but please remember to give us credit by linking back to techreport.com/statistics/uber-statistics in your post.
Convenience and lower prices are among the most important reasons why people choose Uber over other taxi services. And in terms of customer loyalty, Uber’s retention rate in the US is 55%, meaning 55% of users who have used Uber once will likely do so again.
Uber Drivers Statistics
As of Q4 of 2022, there were 5.4 million Uber drivers and couriers using the platform to make money worldwide – an all-time high, according to Uber’s Q4 report. This is a significant increase compared to 2021’s 3.5 million drivers.
In this section, we’ll take a closer look at Uber driver statistics around the world and key insights into the topic.
Driver Statistics by Region
In the US alone, there were over a million Uber drivers as of 2020. The number is likely to be much higher today. According to Ridester, California and New York have the highest concentration of Uber drivers in the US.
As for the UK, 2022 saw a surge of drivers joining the company as a result of the cost-of-living crisis. As of August 2022, the Financial Times estimated that the country had around 85,000 Uber drivers and couriers (with 45,000 active in London), an increase from 70,000 a year before.
This growth transpired despite predicted regulatory challenges of treating Uber drivers as workers rather than independent contractors.
Driver Earnings Statistics
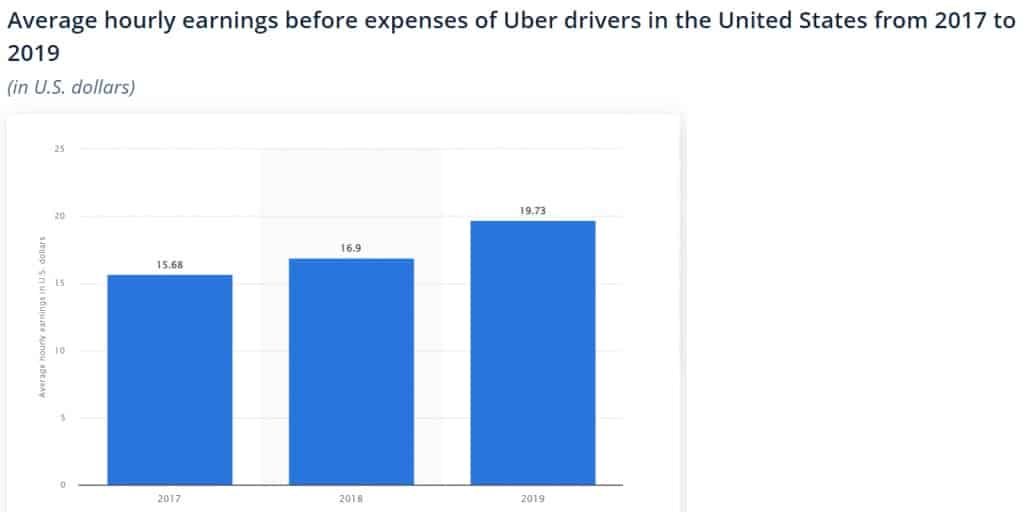
Source: Statista
Uber pays drivers 75% of each ride’s fare, retaining 25%. But a driver’s average earnings vary on the basis of location and demand, as well as on how many orders they take
For example, in 2019, the average hourly earnings of an American Uber driver were $19.73. Here’s a breakdown of the average annual salaries of Uber drivers around the globe, according to Glassdoor:
| Country | Annual earnings, local currency |
| USA | $42,500 |
| UK | £25,000 |
| Australia | AUD 42,580 |
| Canada | CAD 39,170 |
| Brazil | R 36,000 |
| Germany | €46,000 |
| Japan | ¥2,900,400 |
Uber Revenue Statistics
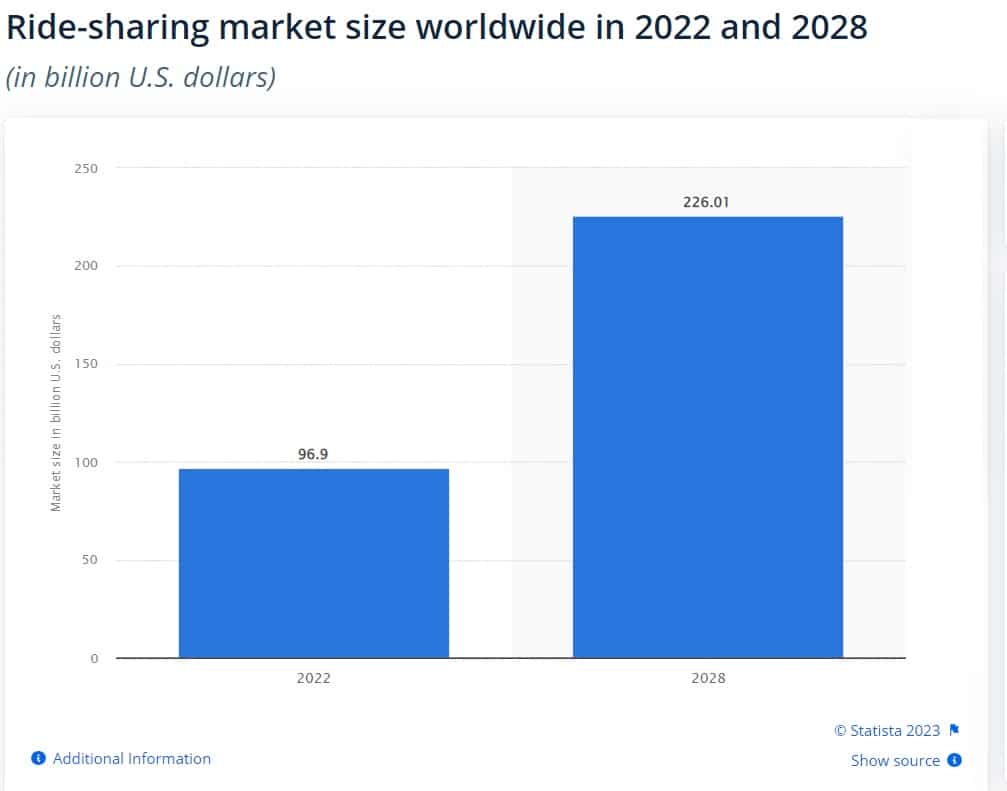
Source: Statista
The global ride-sharing market is growing significantly and is expected to reach $226 billion by 2028, with Uber as one of its key players. We’ll now take a look at Uber’s overall revenue performance in recent years, its market share, and its value.
Total Uber Revenue
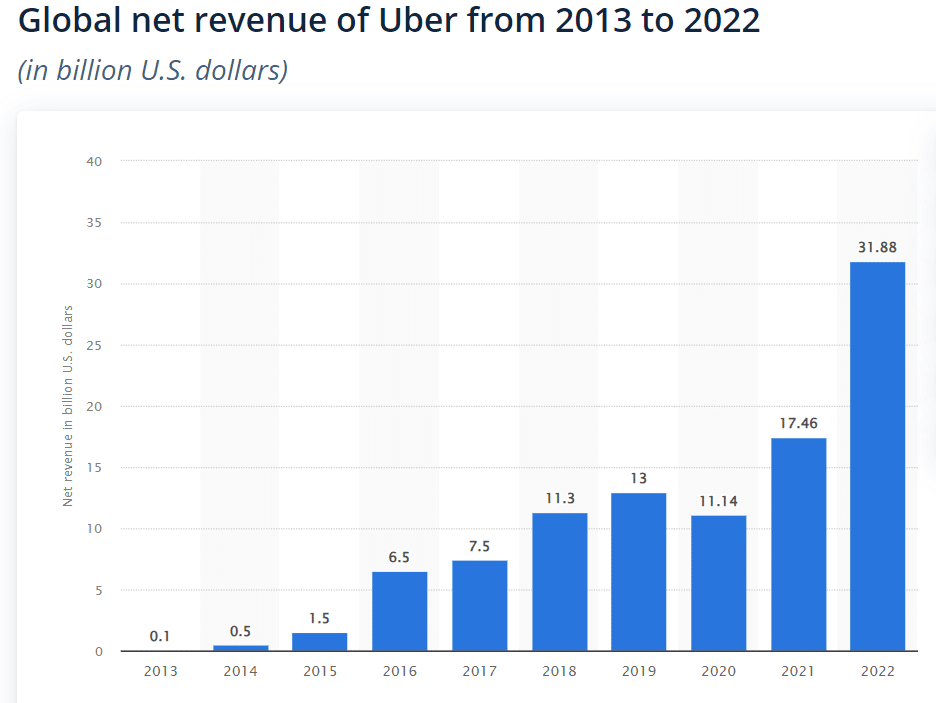
Source: Statista
In 2022, the total net revenue of Uber was $31.88 billion – almost double the year before, at $17.46 billion.
According to Uber’s quarterly report, revenue figures reached $8.82 billion for Q1 2023 alone – some $200 million more than the previous quarter. The Q1 2023 figures also demonstrate YoY growth of 29%.
Uber Revenue & Market Share by Region
Like this infographic? Feel free to use it on your website or blog, but please remember to give us credit by linking back to techreport.com/statistics/uber-statistics in your post.
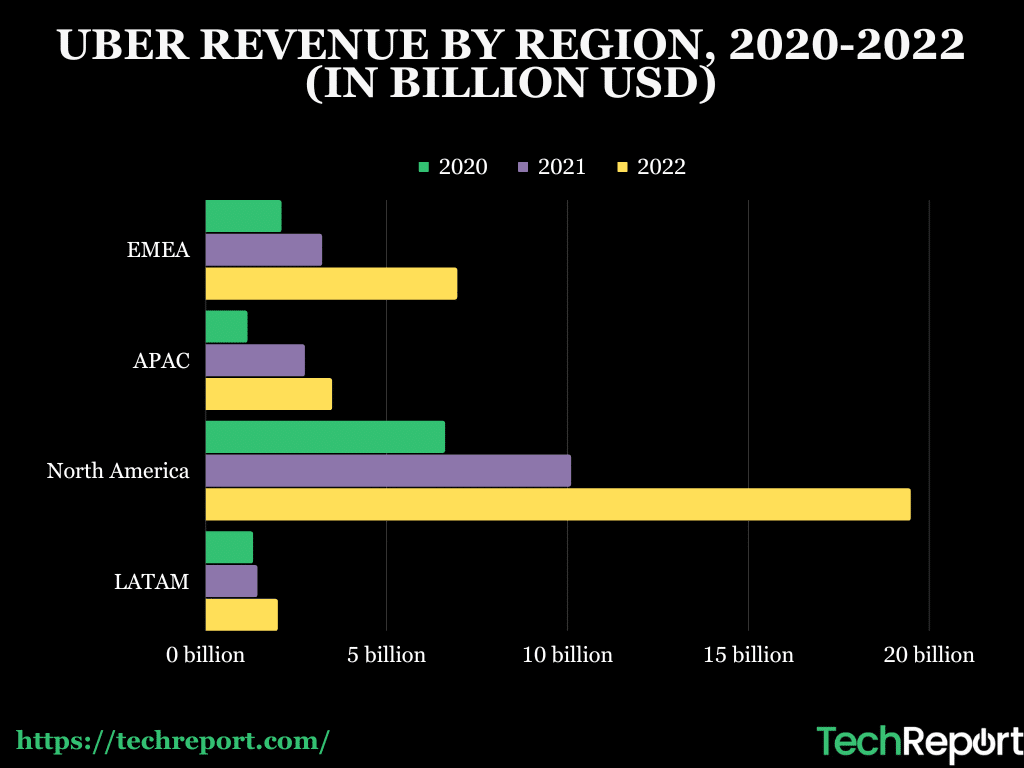
The North American market has consistently brought in the most revenue of any region for Uber – and especially so in 2022, when it brought in almost $19 billion.
However, despite various restrictions in European countries, Uber is doing well in EMEA as well, where 2022 revenue showed a 110% YoY growth. LATAM has been bringing in the least revenue in recent years.
In terms of market share, Uber has an almost 75% share of the US ride-sharing market, up from 62% in 2020. Its closest competitor, Lyft, only has 24% (down from 38% in 2020).
Revenue by Sources
Like this infographic? Feel free to use it on your website or blog, but please remember to give us credit by linking back to techreport.com/statistics/uber-statistics in your post.
Uber revenue comes from streams including ride-hailing, delivery (such as Uber Eats), Uber Freight, and advertising. In this section, we’ll consider these sources, with the exception of Uber Eats, which will be explored in a future article.
Rides & Mobility
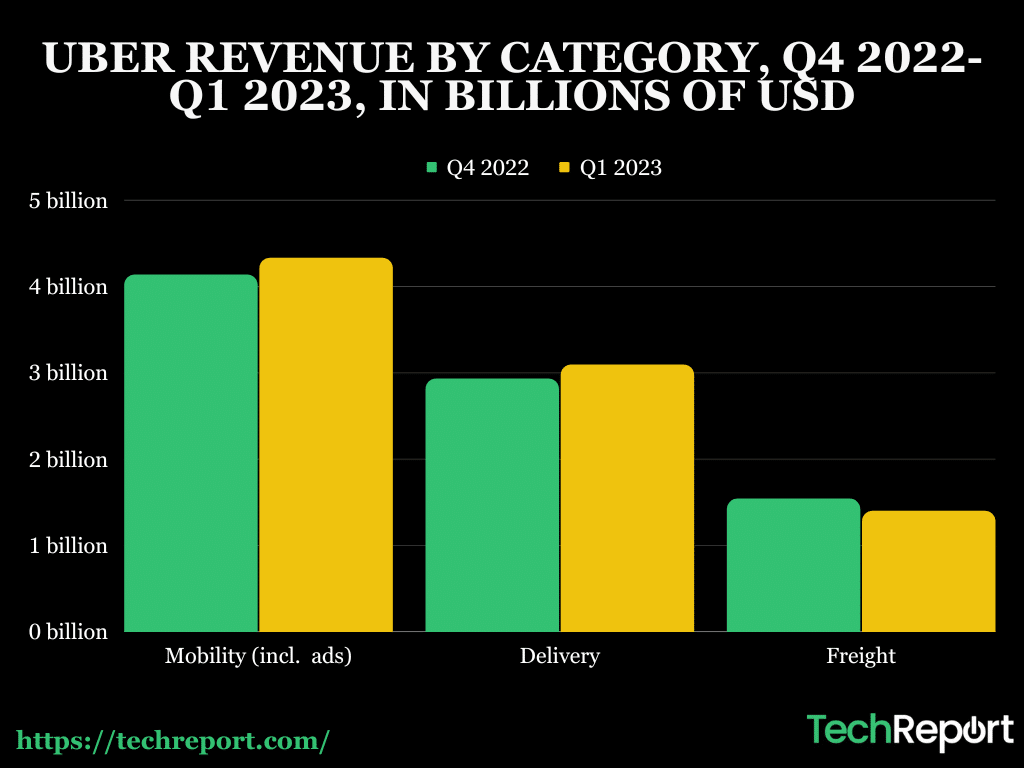
According to Uber’s investor report for 2022, 22% of Gross Mobility revenue came from five cities – New York, LA, Chicago, Sao Paolo, and London. 15% of Mobility bookings’ revenue came from airport bookings.
In terms of mobility revenue, you can see from the chart above that it exceeded $4.1 billion in Q4 2022 and grew to $4.33 billion in Q1 2023.
Freight Services
Source: Statista
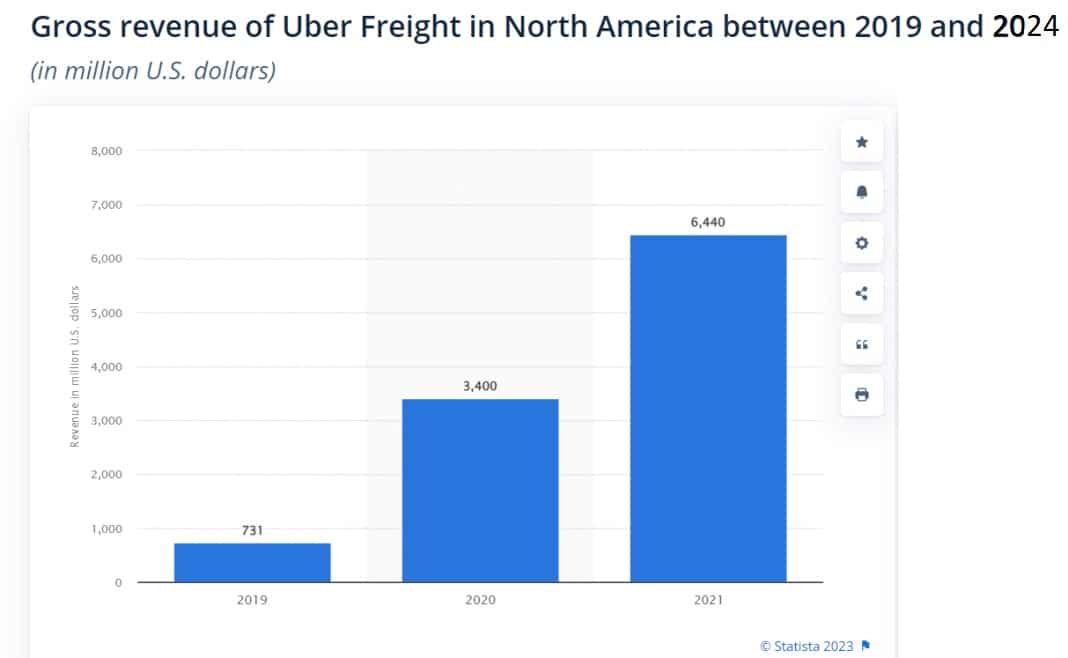
Uber Freight is a B2B transport and logistics service offered by Uber. Although it makes up a relatively small segment of the company’s operations, it’s been growing in recent years. In 2021, its revenue surpassed $6.4 billion, and in Q1 2023, the segment made Uber $1.4 billion – slightly less than the previous quarter.
Advertising
Source: Statista
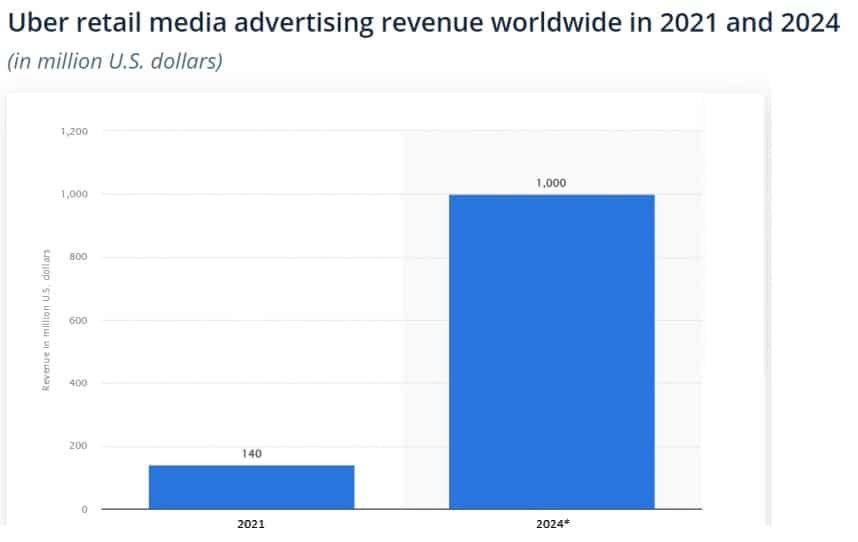
Uber’s advertising division was launched in 2022, and as of December 2022, the company has over 315,000 advertising partners.
According to Uber CEO Dara Khosrowshahi, the company is on track to make $1 billion in advertising revenue in 2024, having reached $500 million in annual ad revenue in 2022. Ad revenue is included in the mobility revenue stream, according to Uber’s annual report.
Valuation & Funding
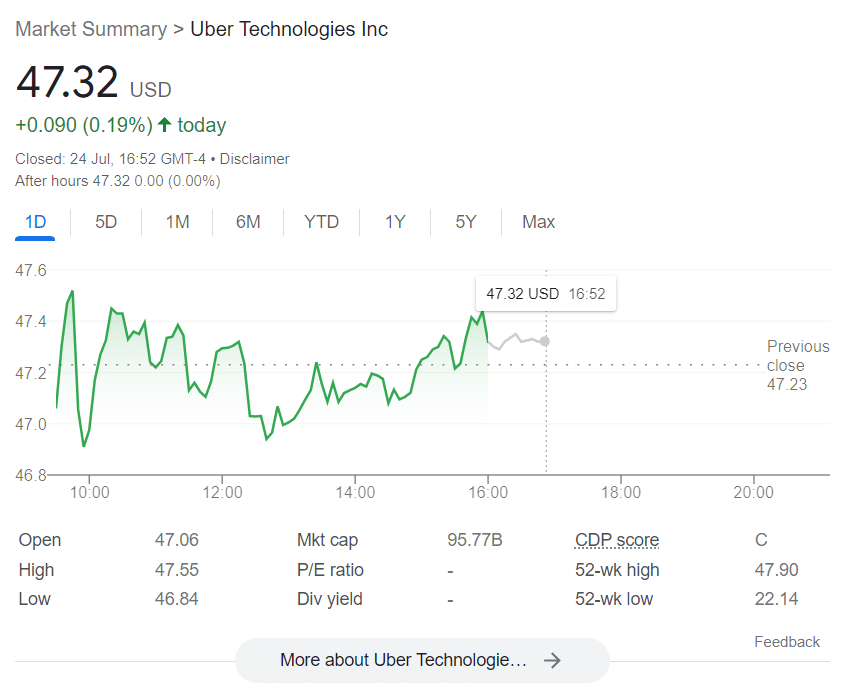
Source: Google Finance
Uber went public in 2019 at the New York Stock Exchange with a share price of $45, when it was valued at $69 billion. As of July 24, 2023, its share price is $47.32, and its market cap is $95 billion.
The company went through 32 funding rounds and raised $25.2 billion, according to Crunchbase. The last funding round was a post-IPO debt round which closed in September 2020 and saw Uber raise $500 million.
Uber Safety Statistics
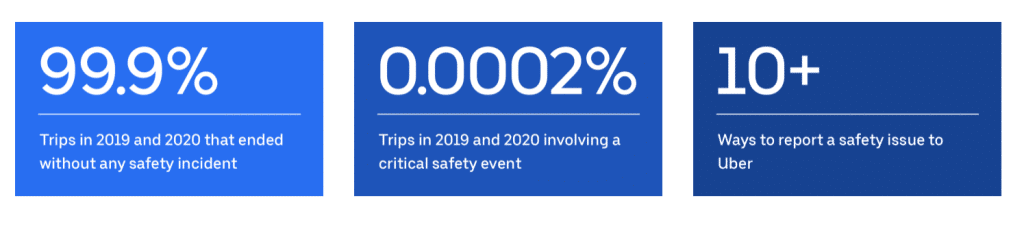
Source: Uber
Although Uber reports that most of its trips are completely safe, the concept of “getting into a car with a stranger” comes with its own risks.
That’s not to say, though, that the company hasn’t worked hard to implement safety measures to protect its passengers and its drivers. In this section, we’ll take a look at Uber’s safety and incidents statistics and the measures taken by the company to mitigate risks.
Uber Safety & Incidents Statistics
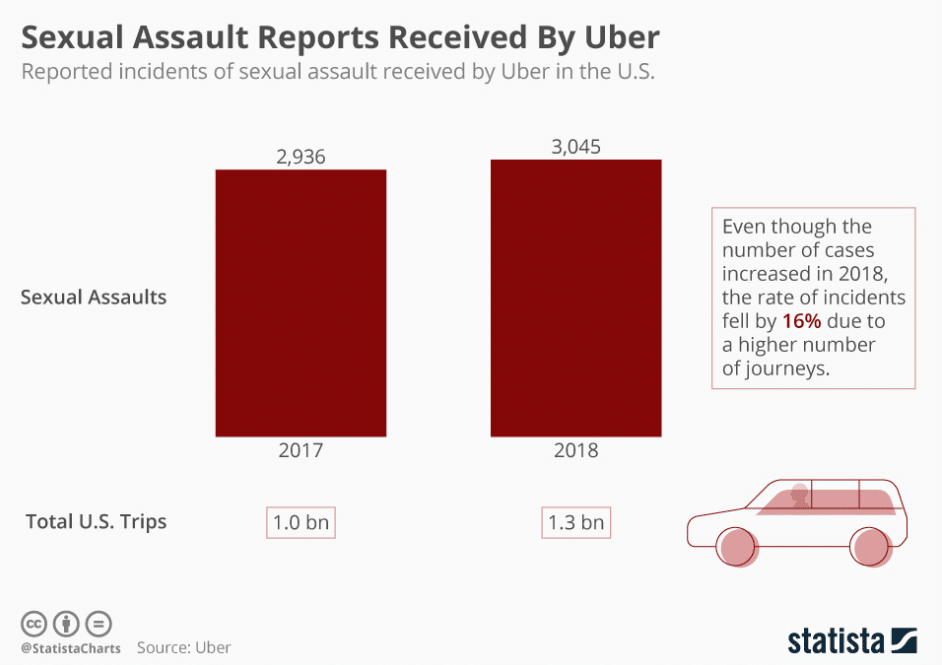
Source: Statista
According to Uber’s 2019-2020 Safety Report released in 2022, 99.9% of Uber trips occurred without incident in the US in 2019-2020.
In terms of incidents that transpired during that period:
- 101 people died in vehicle crashes involving Uber – approximately 1 in 20 million rides.
- 15 passengers and 5 drivers were killed in physical assaults – approximately 1 in 100 million rides.
- 3,824 people reported a sexual assault taking place during an Uber ride – down from 5,981 reported in 2017-2018.
Uber Safety Measures
To address the risks, Uber has been implementing various safety measures. Here are some of them.
Safety Toolkit
The app’s Safety Toolkit feature helps users stay safe during their trip. The toolkit includes an emergency button, a “ShareMyTrip” feature which lets your trusted contacts know where you are, and a RideCheck feature, where the company reaches out to you in case of an accident or a prolonged stop.
In addition, Uber launched an incident reporting feature in the Safety Toolkit in 2020. Riders can file a report in case of dangerous driving or otherwise rude or dangerous behavior exhibited by the driver.
Driver Verification & ID Checks
Uber’s Verify Your Ride feature ensures that you’re in the right vehicle and with the right driver. If the app is unable to verify the driver, you can cancel the ride
Uber also conducts ID checks to confirm the driver’s identity. These checks involve verifying the authenticity of the driver’s license and other documents submitted during the registration process. This helps in preventing fraud and ensures that the person applying to become an Uber driver is who they claim to be.
In addition, some Uber divisions have been implementing facial recognition technology for drivers – though this is not without its controversies. When drivers sign up or log into the app, they may be required to undergo facial recognition checks to match their face with the profile photo.
Uber Regulatory Statistics
Being a trailblazer in the gig economy comes with its challenges. Often, regulations cannot keep up with economic developments and fall short of innovative approaches. Uber has been a textbook case of this.
Employment Controversies
One of the most common regulatory challenges faced by Uber is related to the status of its drivers around the world. This is one of the most significant risks outlined by the company in its 2022 investor report.
If Uber drivers are recognized as employees or workers, the company faces significant costs and the potential for labor disputes.
For example, over 150,000 American drivers filed arbitration claims against the company in 2022 on the issue of their status as contractors, and Uber had to pay $512 million in settlement.
Uber’s European operations haven’t been immune to such disputes, either. Courts in the UK and the Netherlands found that Uber drivers were not independent contractors but, in the case of the UK, that they were employees or workers.
The recent passing of a Spanish law on the rights of digital platform workers achieved the same outcome by classifying Uber drivers as workers.
Privacy Controversies
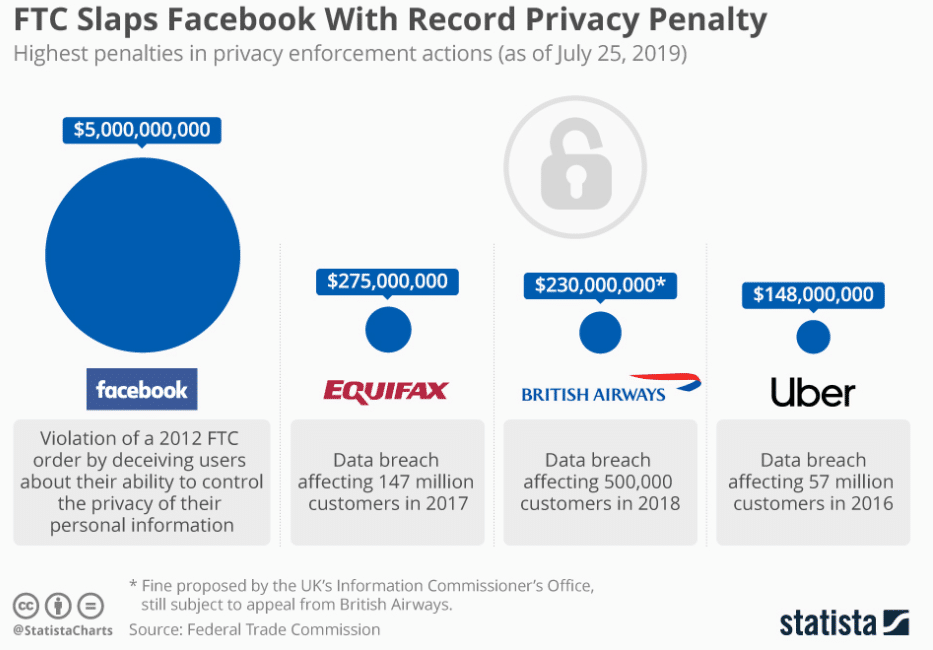
Source: Statista
Although Uber hasn’t received any GDPR fines to date, it has its own history of privacy issues. The company and the third-party contractors in possession of Uber users’ data have suffered data breaches in the last ten years.
The most recent data breach came from Uber’s law firm Genova Burns in January 2023, when hackers stole sensitive and personal information pertaining to Uber drivers.
Before that, Uber admitted to paying off hackers in 2016 who stole the records of 57 million Uber users. Since this data breach had taken place before the GDPR came into force, the company received a fine under the legislation in place at the time, amounting to $148 million.
Future Uber Trends & Impact
Despite the associated controversies and challenges, Uber has fundamentally changed the transport and ride-sharing industries. As observed by a study from the Australian National University, Uber has been a pioneer in the sharing economy and gig working transformation.
We expect that Uber’s impact will be felt for a long time and that the company will advance and adapt to meet regulatory and economic challenges. We’ll now take a final look at its impact.
Transport Industry Disruption
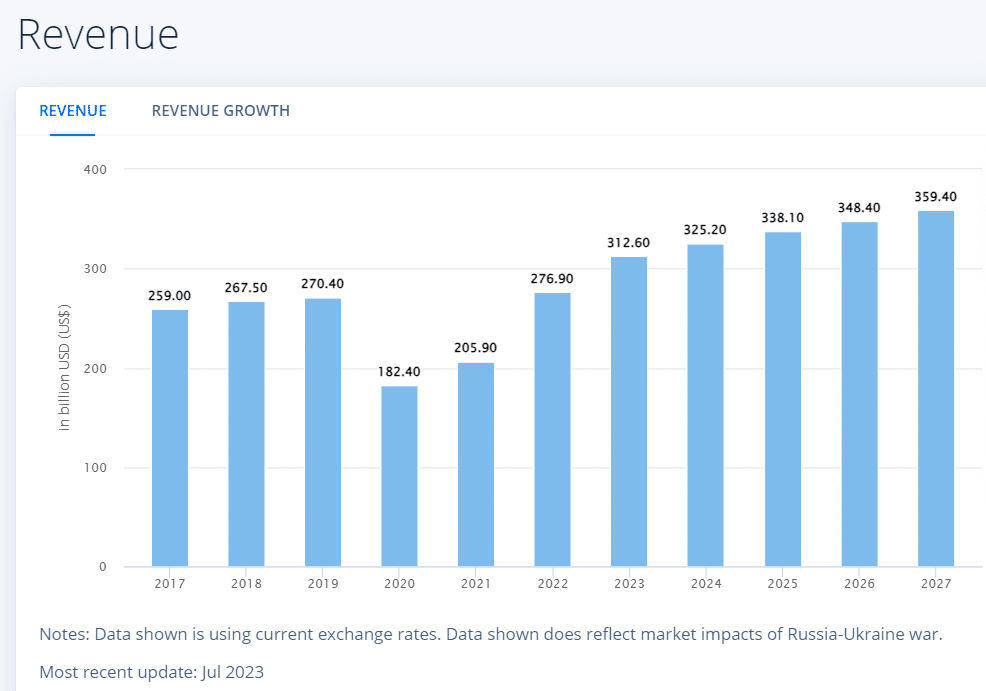
Source: Statista
In recent years, Uber has revolutionized how we move around cities, disrupting the transportation industry and setting new trends. The rise of ride-hailing services like Uber and its competitors such as Lyft is a testament to this.
These companies are challenging the dominance of taxis and transforming how people use transportation. Uber’s influence on the industry is only expanding as its innovative approach continues to inspire new trends and reshape the future of mobility. The revenue of the ride-hailing market is predicted to reach $359.4 billion by 2027.
Uber’s efficient use of mobile technology is a big reason for its significant influence. By leveraging smartphone apps, GPS tracking, and data analytics, Uber streamlined the process of booking rides, making the service quick, convenient, and accessible for over 130 million people.
This tech-driven approach pushed traditional taxi companies to adapt and explore similar technologies to stay competitive, leading to a more tech-invested transport sector overall.
More fundamentally, Uber’s model has opened doors for peer-to-peer ride-sharing platforms, allowing regular car owners to become part-time drivers and earn income from their vehicles. We’ll now take a look at its impact on the gig economy.
Uberization of Services & the Gig Economy
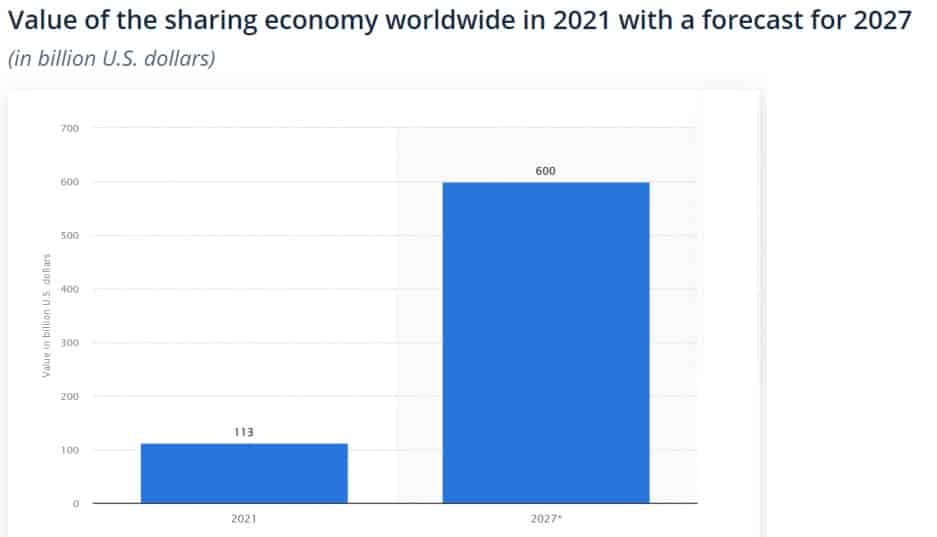
Source: Statista
In addition to transforming the transport industry, Uber has sparked the “Uberization” trend across various economic sectors.
The term “Uberization” refers to the adoption Uber’s business model in different industries, where on-demand services are provided at the press of a button. This concept has been applied to food delivery, package courier services, laundry, grocery shopping, and B2B freight delivery.
The impact of Uberization is evident in the way consumers increasingly expect instant convenience from service providers. Companies are racing to provide faster and more efficient services by adopting app-based platforms and fast delivery. It’s not surprising, given the increasing prevalence of mobile services in our lives.
This shift towards on-demand services is creating new opportunities for entrepreneurs and gig workers. However, as we’ve seen from Uber’s experience, it also raises questions about workers’ rights and labor regulations.
The “Uber for X” trend has led to the rise of startups and businesses attempting to replicate Uber’s success in niche markets. This is another example of how influential Uber’s business model has become as a blueprint for disruption and innovation.
Uber’s Future Growth – What’s Next?
As Uber continues to disrupt the world of transportation, prospects for future growth appear promising. With its disruptive approach, Uber has already left a significant mark on the transport industry, and the impact of the “Uberization” phenomenon has permeated across service sectors.
Looking ahead, Uber’s growth trajectory looks likely to continue, driven by ongoing technological advancements in the automotive sector, such as through self-driving cars, as well as expansion into new markets and the diversification of its offerings into other modes of transport, such as e-bikes. The journey certainly won’t be without its challenges, though.
References
- 4 Reasons Why Riders Choose Uber (Investopedia)
- 58 Uber Statistics For 2023 (Trending Facts Included) (DemandSage)
- 7 Places Around the World Where Uber Is Banned (Oyster)
- A First Step Toward A New Model For Independent Platform Work (Uber)
- A look back at 2021 (Uber)
- An Economic Analysis of the Sharing Economy: A Case Study in Uber for Taxis (Australian National University )
- Breakdown of reasons consumers chose Uber in Australia in 202 (Statista)
- California Attorney General Becerra, San Francisco District Attorney Gascón Announce $148 Million Settlement with Uber over 2016 Data Breach and Cover-Up (State of California Department of Justice – Office of the Attorney General)
- Freight Management Advances as Uberization Comes into Play (Innovecs)
- FTC Slaps Facebook With Record Privacy Penalty (Statista)
- Global gross booking volume of Uber from Q3 2016 to Q1 2023 (Statista)
- Global net revenue of Uber from 2013 to 2022 (Statista)
- Gross revenue of Uber Freight in North America between 2019 and 2021 (Statista)
- How Many Uber Drivers Are There in 2023? (Ridester)
- How Uber left Lyft in the dust (CNN)
- Is Uber’s driver shortage finally over? (Financial Times)
- Market valuation of selected tech companies at IPO and November 19, 2019 (Statista)
- Monthly number of Uber’s active users worldwide from 2017 to 2023, by quarter (in millions) (Statista)
- Number of rides by Uber worldwide from Q2 2017 to Q1 2023 (Statista)
- Ride-hailing & Taxi – Worldwide (Statista)
- Ride-sharing market size worldwide in 2022 and 2028 (Statista)
- Sexual Assault Reports Received By Uber (Statista)
- Spain’s platform workers win algorithm transparency (Social Europe)
- Surge hiring: Uber seeks 20,000 drivers as TfL grants new licence (Evening Standard)
- The easiest way to manage shipments (Uber – Freight)
- Top Most Lucrative Holidays To Drive Uber (RideGuru)
- Uber 2019-2020 US Safety Report (Uber)
- Uber 2022 Annual Report (Uber)
- Uber Announces Results for First Quarter 2023 (Uber – Investor)
- Uber Announces Results for Fourth Quarter and Full Year 2022 (Uber – Investor)
- Uber brand awareness, usage, popularity, loyalty, and buzz among mobility service users in the United States in 2022 (Statista)
- Uber CompaniesMarketCap profile (CompaniesMarketCap)
- Uber Countries 2023 (World Population Review)
- Uber Crunchbase profile (Crunchbase)
- Uber Data Breaches: Full Timeline Through 2023 (Firewall Times)
- Uber drivers are workers not self-employed, Supreme Court rules (BBC)
- Uber employment rights setback is a ‘gut punch’ to its prospects in the UK (CNBC)
- Uber Forecasts $1B In Ad Revenue By 2024 (MediaPost)
- Uber for X (Product Hunt)
- Uber Glassdoor profile (Glassdoor)
- Uber risks death by a thousand court cases (Politico)
- Uber’s US Safety Report (Uber)
- Uber Technologies- statistics & facts (Statista)
- Value of the sharing economy worldwide in 2021 with a forecast for 2027 (Statista)
- Your guide to maximising earnings and staying safe this New Year’s Eve (Uber)
- What can the Uber breach teach us about information security? (DataGuard)
- Why CEOs of all industries need to embrace uberization (Fast Company)